
Thesis
Introduction

Imagining a different view Problems of perception An animated response Overview of the study How to read the thesis
'We are ourselves nature'
(Chris Drury in Gooding, 2007, p.2)
During the summer of 2001-2002 I worked as an Arts Fellow with the Australian Antarctic Division (AAD) on the seventh voyage (V7) of that season. Like other artists before me, I went to experience Antarctica and to communicate something of that through my practice. Like the scientists who work in Antarctica, I proposed a programme for research.
The main research programme for V7 was to measure chemical changes in the water around the Amery Ice Shelf, where Antarctica's largest glacier, the Lambert, meets the sea. The aim was to collect data from instruments in the region, to understand what changes happening in the ice relate to sea levels rising (Church and Rintoul, 2005).
My proposal was to gather material with which to make art works to raise public awareness of Antarctica. Works that were made included drawings, paintings, prints, assemblages, an animated interactive CD-ROM, called 42 Days, and a sequential version of this, called Imagining a Different View (Roberts, 2003).
Before departing with V7, my most recent knowledge of Antarctica had come from veteran whale observer, Debra Glasgow, who I met on Flinders Island. I met Debra while working on A Little Skiting on the Side (Apps, Annabel, Roberts, Lisa and Kelly, 2000) (Appendix 3C). Her photos of Antarctica had surprised me by their energy and movement. They contradicted the vision I had, until then, of Antarctica as remote and still. Debra's images of delicate patterned ice, shaped by wind and changing temperatures, reflected a strong connection to natural forces closely seen and felt. They reflected a sense of how Antarctica is shaped. These were the images that moved me to go to Antarctica, even though I was unconscious of this impulse at the time.
I arrived in Antarctica in February 2002, on the day that George Bush refused to ratify the Kyoto Protocol. Expressions of disbelief on the faces of the scientists on board stirred me to find out how they saw Antarctica. But they had come to work on their research programs, not mine. Although they shared some fragments of their knowledge, there was no time to get a sense of what they were observing. The journey would be the catalyst for future work.
In Antarctica I collected plankton from a frozen lake with a biologist, and scrambled over rocks with a geologist to see an elephant seal wallow. I stood with fellow expeditioners to watch water reflecting up to the sky (water skies) (Figure 1.1) and charged solar particles fluorescing gas in the upper atmosphere auroras). I studied the varying surface textures of water, shaped by wind and currents (waves) (Figure 1.2). Each day I drew, painted, wrote, animated and practiced Tai Chi. I experienced a heightened sense of the forces that martial artist Paul Crompton describes as 'merging':
Moving slowly, ... breathing, it seems, in time with a gentle breeze; merging with Nature itself ... Head, shoulders, arms, trunk, legs and feet move as one; continuously, smoothly and restfully; as if swimming into a new, all-pervading element; a different time, a different space (Crompton, 1992, p.vi).

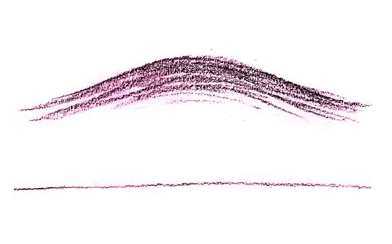
Figure 1.1. Lisa Roberts, Lens (Water sky), Pencil on notebook paper (detail) (2002)
Visual observations were preceded by bodily, or kinaesthetic, sensations. These sensations varied in quality and intensity. Drawings were made while standing on the bridge of the ship. High above the hull, the pitching and rolling motion of the sea beneath was amplified. Lines that were drawn while observing the waves from this position recorded my amplified motion with the ship through the water.
A more visceral connection to the sea was felt when working below deck, closer to the swell of the sea, where I had set up a studio in a small science lab. Figure 1.3 shows the result of placing pools of ink and water on paper, to trace patterns of our motion through a storm. Like a seismograph that measures the force of an earthquake, a pool of ink and water traces forces of the sea. One mark was recognised as a creature. I imagined it screaming with the high pitched sound of the ship's stabilisers. The mark describes the motion of the ship and a feeling of being a part of that motion. Pools of ink and water could objectively record and, at the same time, express a sensation of movement. I selected from these marks those that most resonated with my feelings.
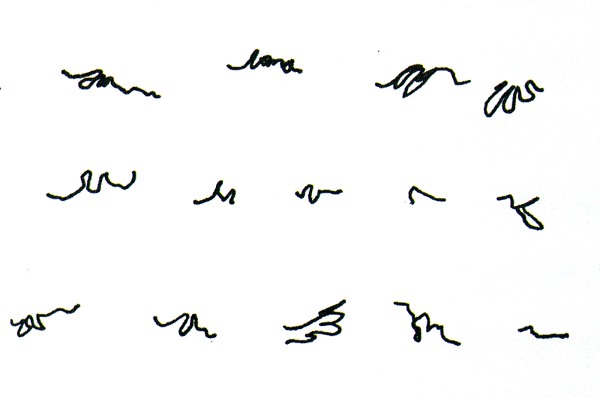
Figure 1.2. Lisa Roberts, 'Change' (42 days, Day 09 2002), Digital print (Detail) (2002)
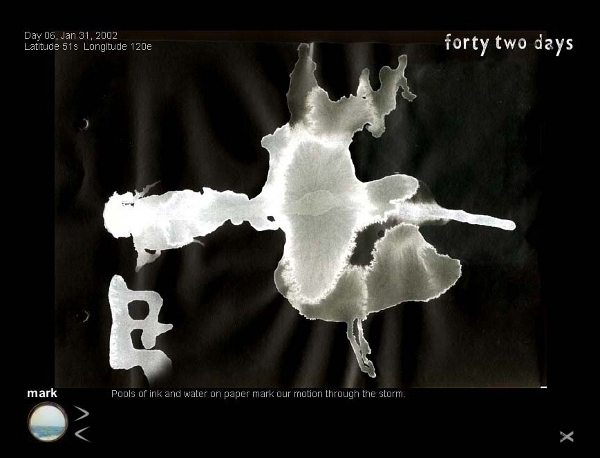
Figure 1.3. Lisa Roberts, 'Change' (42 days, Day 09 2002), Digital print (Detail) (2002)
Other methods were used to describe body connections to Antarctica (Figure 1.4). For example, a method of body-motion drawing was developed. While holding a pen as still as possible over paper, I allowed the motion of my body to govern the forms of the lines. Lines trace body motion governed by the force of a storm. This way of drawing is completely opposite, but in many ways similar, to a seismograph's capturing of Earth motions.
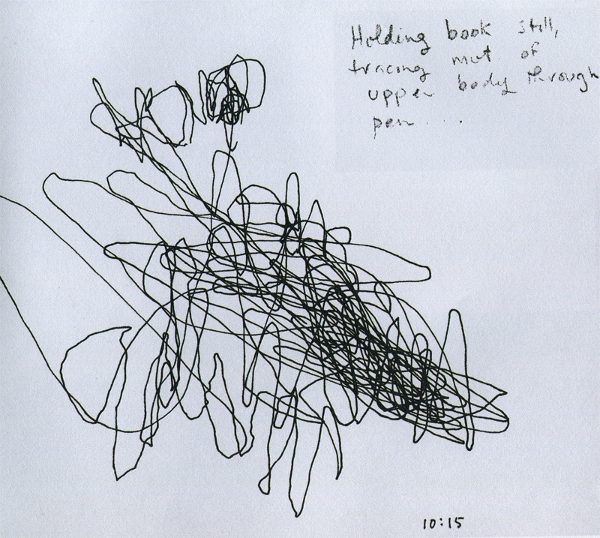
Figure 1.4. Lisa Roberts, Trace of body motion through the Southern Ocean, 31 Jan 2002, Pen and ink on notebook paper (2002)
On the third day of the journey, high winds blew over crests of waves, breaking them up into frothy white forms. Figure 1.5 shows how these forms were described in paint and ink as profusions of curly lines. Tracings of these lines were used to make small 'wave' animations, which were later included in Imagining a Different View.

Figure 1.5. Lisa Roberts, Drawing in Imagining A Different View, Digital animation on CD-ROM (2003)
Waves appear to draw and re-draw themselves, over the original lines that were made in the journal. The cyclic motions of waves forming and re-forming add a gestural quality. Their fluid lines resemble a kind of calligraphy. Like the animated signature of Hannah Brown, in Roget's Circular (Appendix3B), animated lines trace an internal, empathic response to the environment.
I refer to this technique, of animating drawings made directly from life, to simulate the gestures made to draw them, as simulated-drawing. This method was later used to watch and draw live krill, and to trace gestures and drawings made by other artists.
On the eighth evening of the voyage, a green dot appeared on a radar screen that was tracking for ice that could damage the ship. Dense ice forms called growlers, that drift below the sea surface, are dangerous to ships (Hince, 2000, p.6). A glowing white form emerged from darkness and mist. It was an ice berg that resembled a castle. While drawing its worn, ethereal form, I experienced contradictory sensations of closeness and distance. For no apparent reason, drawing this form brought to mind the moment I drew my mother as she was dying.
Figure 1.6 shows how the image, 'Berg' (Day 08, 2002), combines this drawing with the sound form of the spoken word, 'berg' (Roberts, 2003).
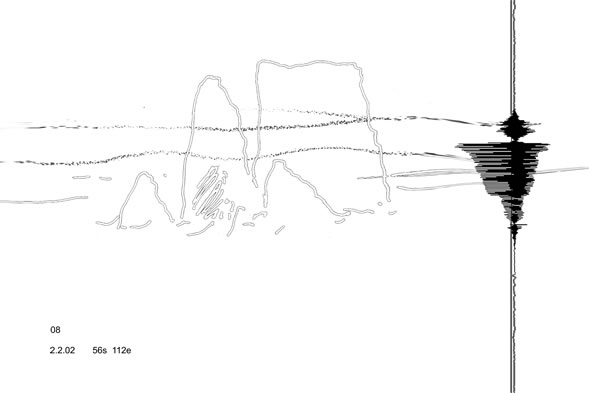
Figure 1.6. Lisa Roberts, 'Berg' (Day 08, 2002), Digital print (2003)
A sound form is a digital visualisation of sound; it is aural data. The lines within the data connect to the lines that describe the mist through which the ice emerged. Vertical and horizontal lines, placed to resemble a cross, describe paradoxical feelings of closeness and distance, that were remembered in the moment of drawing. Body memories of drawing my mother were recognised through the gestures I made to draw the ice. Perhaps this icy environment evokes a primal sense of mortality.
These memories of first seeing an ice berg helped me to empathise with other people who struggle with words to describe deeply felt personal experiences. It made it easy for me to understand how Antarctic ice may appear to have a life of its own. We may only be able to speak of the surface of ideas and feelings that we see in the ice. Something more primal was felt within the ice.
As the ship approached Antarctica, everything in sight became silent and still. Ice bergs and sea ice dominated the view. Scientists explained that sea ice dampens the turbulence of the sea by its massive weight. This mechanical explanation deepened my understanding of what I was sensing.
On the bridge of the ship I observed a scientist writing poetry. He talked about the poetry of the ice. He read his poems to me. This made me wonder what depths of understanding seasoned expeditioners might have of Antarctica. Further conversations with scientists and other expeditioners prompted the idea that if their voices could be recorded, animations could be made to reflect their knowledge.
After days of grey stormy seas, the white expanse of ice appeared ethereal and calm. To capture the subtle changes in the skies and passing ice forms, I drew more swiftly. The lines became simpler, stronger, and more flowing. As the views became more elemental, more subtleties could be discerned. The drawing of sea ice made on day thirteen (Figure 1.7) reflects subtle variations in shapes and tones within the ice and sky.
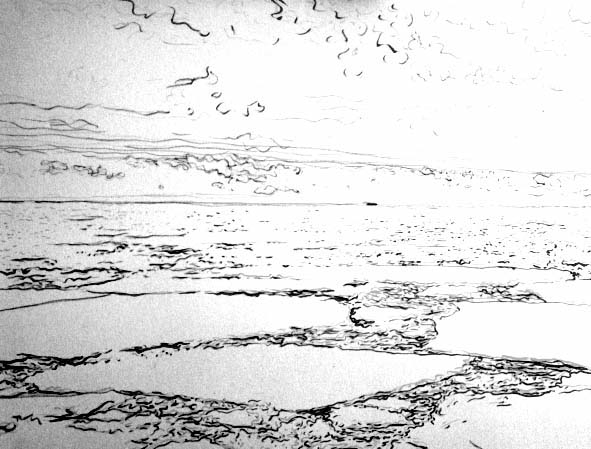
Figure 1.7. Lisa Roberts, Day 13, 2002, 42 Days, Animated interactive CD-ROM (2003)
After days of intense drawing, it seemed possible to trace the choreography of this moving world. Sensations that were to become body memories of Antarctica were laid down by moving through it, and from drawing. The body memories added a sense of moving through a space that was at the same time being measured and expressed as data.
Paradoxically, the sense of Antarctica as an elusive moving form heighten after arriving on land. Climbing Mount Henderson, which pokes up through the ice sheet inland from Mawson station, I could imagine its massive height by imagining the depth of rock hidden beneath. Looking around from its summit, the world appeared wider. Horizons at the poles physically extend further than at any other places on Earth; like an orange that has been squashed gently at both ends, the poles are flattened by centripetal forces that spin the world around. A sense of scale can be measured according to our senses.
The day I climbed Mt Henderson (Figure 1.8) the air was, I was later told, unusually clear and still. The silence seemed to free my mind. I imagined the time it took to form this massive structure, and for crystals of snow to gather over it. I felt grounded by solid, ice-bound rock, and uplifted by clear sky. Blood pumping through through my head seemed to cry, 'I am part of this living world'. Lines drawn in that moment record this brief sensation, of being somehow balanced between space and time, within an infinite void.
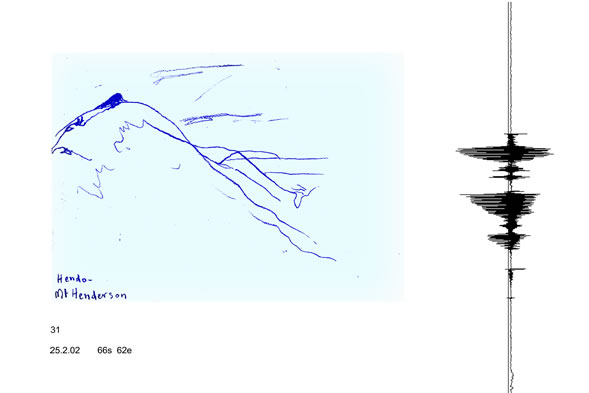
Figure 1.8. Lisa Roberts, 'katabatic' (Day 31, 2002), Digital print (2003)
Antarctica is extreme, remote and inaccessible. Although changes within Antarctica can be clearly discerned and measured, this place is notoriously difficult to describe from lived experience. It is possibly the place that offers humans the least number of sensory stimuli and yet our senses can be heightened there. Artists struggle to represent a place that many people perceive as empty. Scientists struggle to explain how it works as an ecosystem and to engage the public with what they understand. Although Antarctica is remote from everyday experience, it is vital that its changes be understood. Evidence has been found in Antarctica that implicates human behaviour in the disruption of the natural cycles of global climate change.
Animations offer scientists other ways of knowing that are not easily available to them. Artistic and scientific knowledge of Antarctica is usually presented in separate conferences, exhibitions and online repositories. When combined, however, depths of meaning can be added to these different ways of knowing. Scientific data sets are often compiled using methods that require a degree of separation from the subject of investigation. Data sets alone provide no sense of how people experience the world. They have become disembodied measurements. In this time of confusion about what changes are actually happening in Antarctica, the insights of scientists need to be combined with those of artists in order to make their data more accessible to the public.
An elemental language of gesture and line has been used by humans since ancient times to embody a primal understanding of our place in the world. This accords with Indigenous and Gaia world views, that we are part of a living Earth. By Indigenous I mean a way that humans relate to the environment that is shaped by common elemental structures. By Gaia I refer to the hypothesis that Earth maintains conditions that are suitable for life, through a dynamic balance of interacting physical and biological forces.
The research question is, can animation be used to combine scientific data with subjective responses to Antarctica? My aim is to make animations that combine scientific perceptions with bodily responses using gesture and line in order to communicate accurate information about climate change. By ‘gesture’ I mean a movement performed consciously or unconsciously through the body. By ‘line’ I mean a trace form, described by a gesture, that is visible as a mark made in physical form, or that can be imagined in the space used to perform the gesture. ‘Trace forms’ are lines that describe energy flows between the human body and the environment. These energy flows are also referred to as ‘lines of force’. My use of gesture is not be confused with forms of anthropomorphism that ascribe social attributes of humans to other living forms. I have used a lexicon of primal gestural forms that, when recognised, promotes a form of deep understanding associated with body knowledge.
The circle, spiral and cross describe structures within the Antarctic ecosystem and the forms that are most naturally traced by human gestures. Gesture is assumed to predate writing as our first language (Corballis, 1999). The symbols of the circle, spiral and cross have been identified as trace forms of primal gestures. These symbols are traced naturally by virtue of our anatomical structure: the arm pivots at the shoulder to draw a circle; a spiral traces circular motion as it increases or decreases in energy; a looping 'infinity' sign traces a swinging gesture that crosses at the centre (Watts, 1977, p.13). These forms have been recognised, in drawings of children and Great Apes, as 'fundamental' (Watts, 1977, p.10). They are known as 'semantic primitives' that are used in all forms of language (Fricker, 2010). Circling, spiraling and crossing forms appear in both scientific and artistic responses to Antarctica.
Our senses provide knowledge about our environment that allows us to move safely through it (Fox, 2000, p.46);(Lovelock, 2009, p.125). A sense of being part of a global environment comes through the kinesphere (Fox, 2000, p.46). The 'kinesphere' is the extent of an imaginary space that is described by the reach of the body. Within the kinesphere we use all the senses that make us aware of our use of energy and our place in space and time (Exiner and Lloyd, 1977, p.4). Scientific and aesthetic knowledge can be combined to give a sense of the beauty of Antarctica as a unified system that is vital to the natural balance of Earth as a dynamic whole.
In Chapters 2 and 3 different perceptions of Antarctica are reviewed. An iconography of primal gestural forms is identified that communicates a sense of human presence in Antarctica.
Chapter 4 is a review of ways that gesture and line have been used since pre-history to make visible expressions of connection to the natural world.
Chapter 5 is a discussion of how I developed animations from interviews, online interactions, movement workshops and my practice of drawing and movement.
In Chapter 6 the animations Insights and Energies are discussed in relation to a lexicon of primal gestural forms.
Chapter 7 is a critical appraisal of the value of gesture and line in the animations to make sense of scientific data.
Chapter 8 is a conclusion. Responses to the animations (from different communities) are compared and next steps are identified.
Chapter 8 is followed by a Glossary of terms, an Appendix, a list of Figures, a list of Tables and a Bibliography.

The work submitted for examination consists of animations (on a data CD) and an exegesis. Icons in the written text (such as the footsteps on the right hand side here) will refer you to the animations and associated art works. To return from these links to the written text, press the 'Go back one page' button of your internet browser.
The exegesis needs to be read alongside the animations.
Most of the material submitted for examination was developed online through the website, http://antarcticanimation.com. Although the website itself is not submitted for examination, it provides an insight into the complex interactions between people that occurred to develop the thesis.
The Adobe Flash Player plug-in and a web browser (preferably Firefox) are needed to access the animations from the website. If these are not already installed, free versions that are compatible with your system can be selected and downloaded from:
http://get.adobe.com/flashplayer/otherversions/
http://www.downloadfirefoxbrowser.com/
Speakers or headphones will be needed to hear sound. Unless indicated '(Silent)', all the animations have sound.
Sound levels vary, so the volume control on your computer may need to be adjusted accordingly. The volume control on most computers is located on the menu bar of the Desktop or on the keyboard and is usually indicated by an icon that resembles a loud speaker. By clicking on this icon you can access a mute button (which should be unselected) and a slider to control sound levels.
Animations vary in size. This means that some will take longer to load than others. Unless indicated, all animations are less than one minute long.
However, because computers process data at different speeds, the timing of animations will vary. Animations are set to play as repeating loops.


