
Thesis
Methodology and methods

Interviews Online interactions Movement workshops Drawing Animation Animation interfaces Art works
The primary methodology has been practice-based. My practice as an animator has been to use improvised movement, drawing and assemblage to make visible responses to what is just on the edge of understanding. I then develop a lexicon of gestural forms from which to compose discrete works. For examples, see Beware of Pedestrians (Appenxix 3A), Roget's Circular (Appenxix 3B) and A Little Skiting on the Side (Appenxix 3C).
The methods used to develop the material to support the thesis were anchored in a relational world view. Such a view holds that life on Earth is maintained through dynamic relationships between physical and biological systems. This view was identified in Indigenous research methodolgy as described by Shawn Wilson and in the Gaia view of the world as a whole living entity, as promoted by the scientist James Lovelock (Wilson, 2009; Lovelock, 2000). My understanding is that Earth is a system that maintains its life by regulating flows of energy between its parts and that our lives are part of this system and therefore subject to its regulation.
As an artist-scholar with Indigenous and non-Indigenous ancestry, I sought common elements in views that could reconcile what are usually held as opposing ways of knowing. I am part of an Antarctic research community and a community of artists who work with various media. People who were willing to share their practice (in art and/or science) were invited to participate in the project.
Networks were established within the Antarctic community by
Working with the Australian Antarctic Division (AAD) as an arts fellow in Antarctica and as a digital media librarian at the AAD headquarters in Kingston, Tasmania
Joining the Australian National Antarctic Research Expeditions (ANARE) Club in New South Wales
Participating in Antarctic arts and science conferences and exhibitions in Hobart, Sydney, Christchurch, Canada and Buenos Aires
Studying at the Scott Polar Research Institute (SPRI) and the British Antarctic Survey (BAS) in Cambridge
Studying at the University of New South Wales (UNSW) in Sydney
Attending exhibitions of Antarctic arts and sciences in Australia, New Zealand and the UK
Drawing on family connections
Networks were established within art and dance communities by
Working as artist in residence in educational institutions and other communities in Australia
Teaching at the Victorian College of the Arts (VCA), the University of Tasmania (UTAS) and in secondary schools and private practice in Melbourne, Sydney and Launceston
Studying at the VCA, the Royal Melbourne Institute of Technology (RMIT), Eora Aboriginal College (Sydney), UNSW and in dance studios in Europe, the UK, the US and Australia
Joining the Dance Therapy Association of Australia (DTAA)
Ethics approval was obtained to conduct interviews and workshops. Twenty-seven expeditioners and thirty-eight artists formally agreed to participate. Other people participated informally through conversations, emails, and an online research log. Artists were invited to contribute words, images and sounds. Scientists were asked for copies of their papers and data sets, and other texts relevant to the knowledge that they shared.
Antarctica provided many points of connection with expeditioners. Although there were differences between our knowledge and experience, there were feelings of connection that helped to establish empathy and trust.
I established rapport easily with other artists and dancers. Unlike visual artists, who often work in isolation, dancers tend to work together. Because they work in groups and share similar experiences, they often articulate shared knowledge (Exiner and Lloyd, 1977, p.2):
The urge towards expression through Movement seems to be inherent in man today as much as in the past, and its repression will have damaging effects on the mind and body. Yet our social structure does not provide us with opportunities for expressing in movement what we experience in our work and everyday life.
Methods used to make the animations are discussed in sequence. Figure 5.1 shows the interactions that occurred between people, Antarctica and the animations themselves. An animated display of these interactions through time can be seen in the Chronovenn view of the research log (Tey, 2008).
Methods used to collect information were: interviews, online interactions, movement workshops, drawing, animating gestures and lines, and making art works. Interviews were unstructured and improvised. Online interactions were arranged within a controlled space. Methods used in workshops were adapted from those of dance theorist, Rudolph Laban and dance educator, Johanna Exiner (Laban, 1973) ;(Exiner and Kelynack, 1994). Animations were made by accurate line tracing of data and the improvised (straight-ahead) techniques developed by Norman McLaren and Len Lye (McLaren, 1944) ;(Len Lye in Horrocks, no date). Digital media were used to combine scientific data with gestures and line drawings. Art works were made to give physical form to ideas.
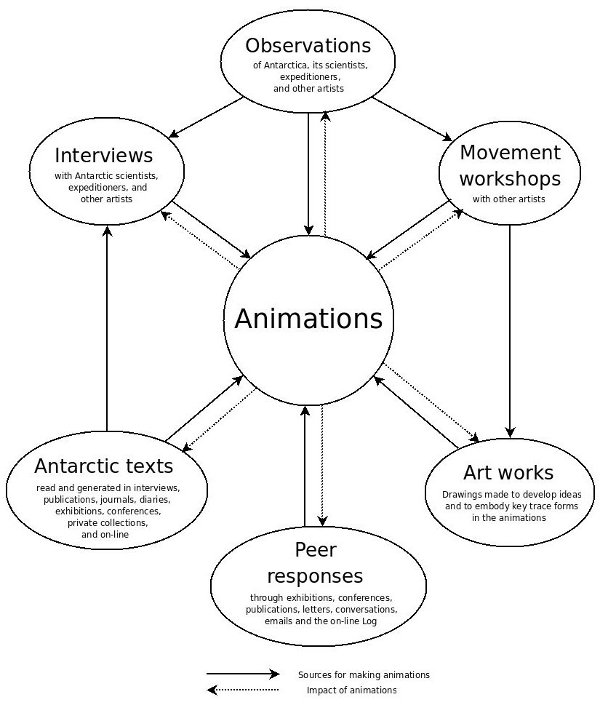
Figure 5.1. Flows of interactions that shaped the animations.
Methods were adapted from those used by Mackay. Mackay had used 'non-directive group discussions and unstructured personal interviews' to reflect the 'mood' of Australians in the 1990's (Mackay, 1993, p.312). Guided by his method, direct questions such as 'What moved you to work in Antarctica?' were avoided when seeking information about feelings. As Mackay explains, 'All such questions assume that there's a reason for doing those things, yet we do many things for no reason at all (at least, for no logical or easily-explained reason)' (Mackay, 1993, p.310). Direct questioning is also avoided in Indigenous research, but for other reasons. Direct questioning can be considered disrespectful.
Information is part of an exchange (it goes both ways). Information is part of a relationship. ... Being indirect (circuitous) is often the best way, especially with important personal matters. It's rude to rush people. It's often rude to make direct eye contact. People should have time to think about things, especially important things: sometimes this means silence. Sometimes this means waiting for a later time to find something out (Sheridan and Tranter, 2000, Unit 3 p.12).
Meetings with participants were devised in ways that were in themselves 'non-rational, non-linear and non-structured, in order to match more closely the nature of the material being investigated' (Mackay, 1993, p.312). Direct questions were found useful for finding out about scientific knowledge, but were avoided when seeking information about aesthetic (sensory) responses.
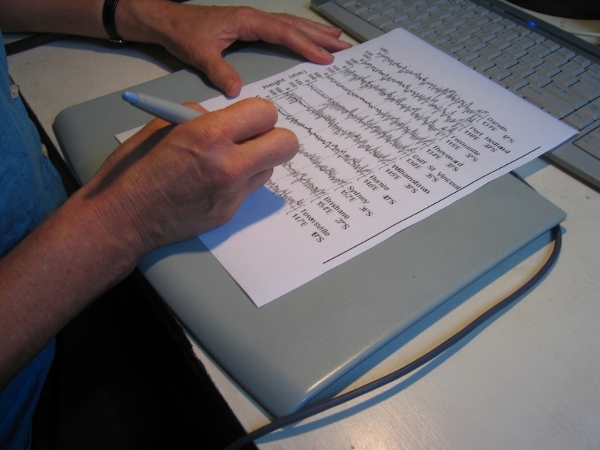
Mackay's group discussion technique involves natural, existing social groups, meeting in their 'natural habitat' (Mackay, 1993, p.312). Meetings with scientists and other expeditioners were conducted in their homes and work places. Explanations were made about the purpose and procedure of the research. A 'Zoom' digital sound device was used to record conversations. Recordings were transcribed and words were selected to accompany online displays of animations.

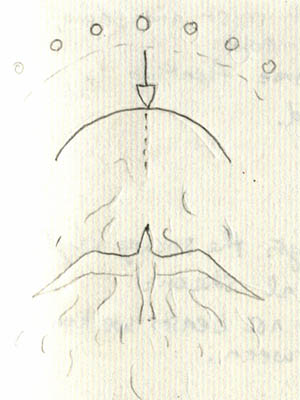
Mental notes were made of tones of voice and gestures. For example, the voice of expeditioner, Colin Christiansen, seemed to arc through space as he described birds calling from the far side of Atlas Cove, Heard Island (a Sub-Antarctic island). The imagined arc was drawn and animated to combine the shape of the cove with the form of a head.
Transcripts of interviews were returned to participants for verification and comment. Corrections, afterthoughts, and additional comments were received through the online log, and by letter, email, and telephone.

An example of this is when Fred Elliott corresponded while Building Mawson was being made. As he watched the animation evolve online, it seemed to trigger memories that he had forgotten in our interview.
Selected transcripts of key interviews that demonstrate these methods are provided in Appendix 1. More details about them can be read throughout Chapters 7: Discussion.
The website, www.antarcticanimation.com, was initially set up (early 2007) in order to display animations. First I built a structure for a thesaurus. This was to contain, organise and display information about Antarctica. There were other areas on the site that were experiments. Some of these were discontinued. For example, I began to describe my own and other peoples' journeys, and to use animation as a way to map Antarctica. These spaces were components of what was to become a research diary. The most successful component of this diary was the blog, which I call the Log.
Wordpress software was used to build the log. The first posting was on 21 March 2007. This recorded my visit to the Sydney Nolan Antarctic exhibition and my first encounter with veteran expeditioner, Jack Ward (See Appendix 1A). This post can be accessed online by inserting 'Nolan: Antarctic journey' in the search field of the log.
Initially, responses received by email and letter were cut and pasted into the site. But the process was soon automated by the Wordpress software. All responses were approved before they were made public.
The website allowed me to have a public conversation with myself about the project and to receive and categorise responses. Categories evolved from recurring themes. As the categories multiplied over time, some were renamed or deleted. This process gave me a birds-eye view of how my ideas were developing.
One of the shortcomings of blogging software is that it lacks a view of the dimensions of the information space. RMIT Masters student, Robert Tey, allowed me to use his prototype programme, Chronovenn, to display the relationships between blog posts through windows in time. The Chronovenn interface (Figure 5.2) displays coloured dots that serve as links to the Wordpress posts. Titles of posts can be viewed by using the mouse to hover over the dots. The dots are arranged in circles. As in a Venn diagram, the circles indicate categories of information. At the start-up of the programme, the dots appear on screen in chronological order. This order is indicated by a time line that moves from left to right beneath them. When the mouse is used to hover over names of categories (placed within each circle), connections between ideas expressed in the posts are made visible as lines.
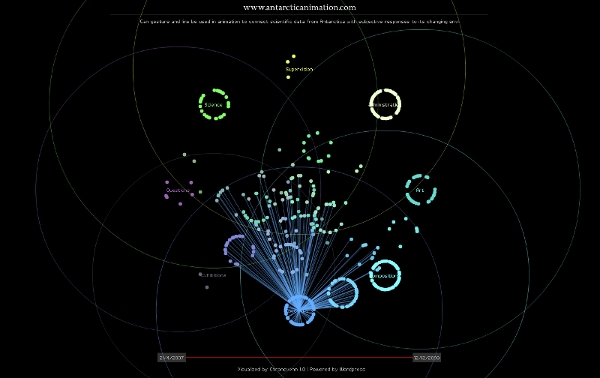
Figure 5.2. Robert Tey, Chronovenn (2008) Online image
Online interactions were integral to the process of developing ideas for animations. They allowed me to make and maintain relationships with communities of Antarctic scientists, expeditioners and other artists.

For example, scientist, So Kawaguchi, responded to the first stages of How do krill grow?. Kawaguchi was leading a research project at the Australian Antarctic Division (AAD) to investigate how krill were coping with increasing ocean acidification. He provided information about normal krill development that I needed to complete the work. The following thread from the log illustrates the importance of this form of engagement. So Kawaguchi (scientist), Rena Czaplinska (artist), and me, comment as the animation is being made:
So Kawaguchi Says: February 12th, 2009 at 9:57 pm
Hi Lisa,
That's really good. There are 2 points that I would like to make. 1) Wiggling of the eggs looks perfect, however, it should be upside down given the direction they hatch out. 2) I just realised that from furcilia onwards, the order of stages are wrong and adult is appearing in the middle and ending up with one still showing larval feature. The animation is a bit too fast so I cannot exactly advice you the right order, but it should be corrected. Otherwise, great!
# Lisa Says: February 14th, 2009 at 2:52 pm
Hi So,
Thanks for your further advice.
I can turn the wiggling of the eggs around the other way, to match the direction they hatch out.
I had a feeling there was one image out of sequence towards the end.
I will fix these things.
# Rena Czaplinska-Archer Says: February 16th, 2009 at 3:32 pm
Lovely, great music, so much joy in this curious creature!
# So Kawaguchi Says: February 19th, 2009 at 12:24 pm
Hi Lisa,
That's great. You may be able to make a couple more improvements, if you like: 1) I think 'developmental ascent' rather than 'diurnal migration' is accurate. If you like you may put 'developmental descent' for the period before they hatch out. 2) Yes, you are missing Furcilia VI, and another one if you are to finish up with adult krill.

This correspondence set in train further interactions with Kawaguchi's colleagues at the AAD. The correspondence was pivotal to the creation of the major work, Energies, and its screening at international science conferences and presentations (See Chapter 8: Conclusion / Impact of the animations).
As Mackay had explained, when conducting research with other people,
There will be leaders and followers; those who are dominant and those who are submissive; agreements and disagreements; side-tracking and wise-cracking (Mackay, 1993, p.312).
Unlike Mackay, who 'played no active part in the discussion', there were times when active involvement was important. For example, a group activity was useful as an ice breaker.
Movement improvisation was chosen as a method to generate responses to Antarctica because deep connections can be accessed through body movement (Magowan, 2005; Quill, 2008).
Following my participation in workshops led by Tony Osborne, Kimberley McIntyre, Vikki Quill, and Mircalla Havier (Sydney); Al Wunder and Peggy Hackney (Melbourne); Gill Clarke (London) (Roberts, 2008; Roberts, 2008; Roberts, 2008; Roberts, 2008; Roberts, 2008; Roberts, 2007; Roberts, 2008) , a series of workshops were held. The workshops I attended had shared the same purpose: to stimulate body awareness through connections to the spaces through which we moved.
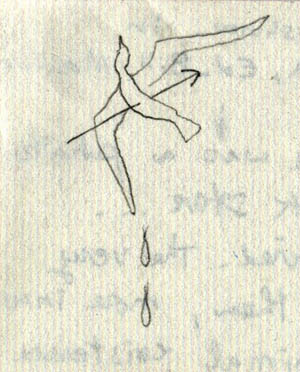
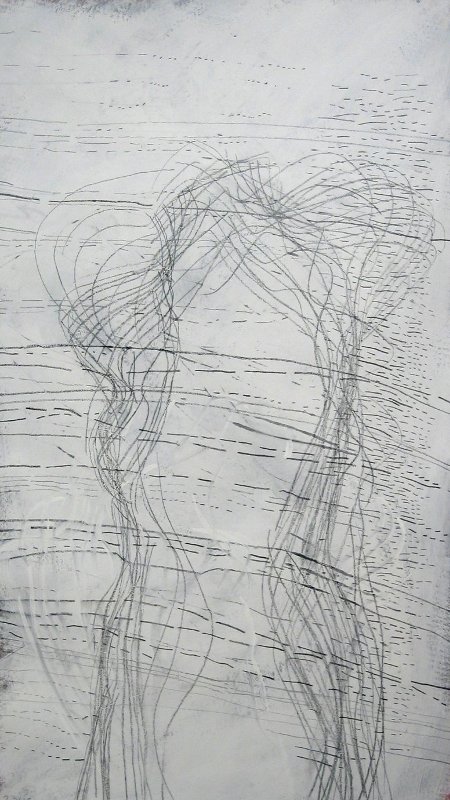
During these workshops, I danced, observed, and drew. I made drawings that traced flows of energy. Figure 5.3 shows how, in the drawing, Osborne dancers, a tortille, or twisted, line connects the gestures of three dancers. The dotted line traces the movement of my eye as it scanned for similarities in shapes within the body lines.

A key process used to conflate scientific data with human and other animal gestures was to observe similarities between physical and biological structures. Drawings like these were used to animate danced responses to Antarctica.
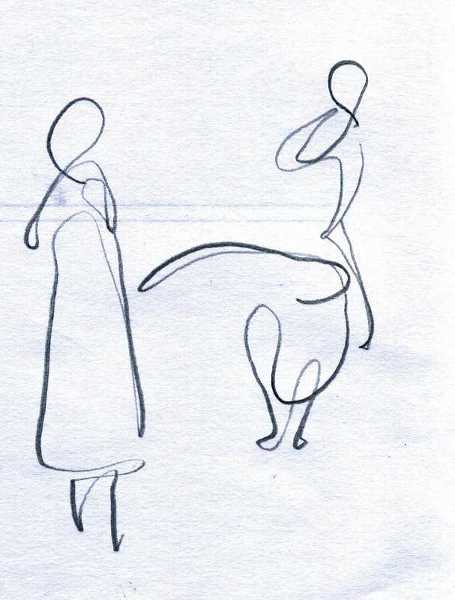
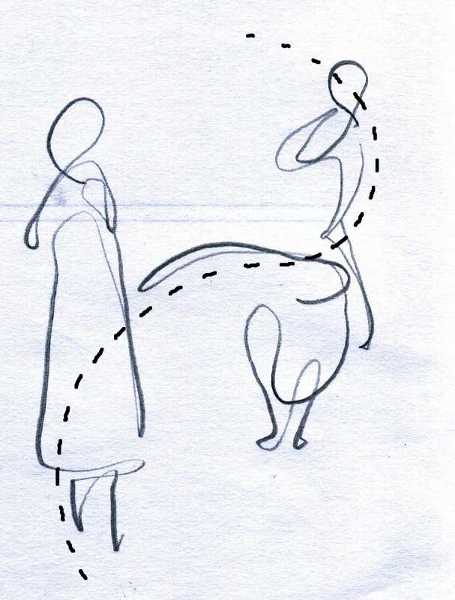
Figure 5.3. Lisa Roberts, Osborne dancers, Pencil on paper (2008)
Drawings were scanned and traced to simulate moments of observing and drawing. The technique, which I call simulated-drawing, has been discussed in the Introduction.
The drawing technique that Jorg Schmeisser describes (Figure 3.1) to capture the dynamic nature of Antarctica, equally describes the process of drawing dancers in motion:
You have to draw the things that are important to you, and there has to be a clarity in what you do, of what you see or feel about it (Schmeisser in Andrews, 2007, p.228).
Schmeisser's method relates closely to dancing 'what you see or feel about'. Clarity in drawn and danced gestures comes from being moved by what is most important.
What is most important in movement improvisation is sensing and expressing kinaesthetic connections. As Laban had demonstrated, through his Space Harmony Crystal (Figure 4.6), structures within the moving body can connect to external structures within the environment (Hodgson, 2001). Moving and drawing are ways to feel and describe energy as it flows through these structures.
During the workshop series, Eye to Eye, led by Al Wunder in Melbourne (2003), I drew (as he described in words and gestures) relationships between Internal, Peripheral and External spaces. Figure 5.4 shows how this image is simpler than the 'onion skin' form of Exiner's Movement Dial (Figure 4.10) and Laban's many-sided Space Harmony Crystal (Figure 4.6).
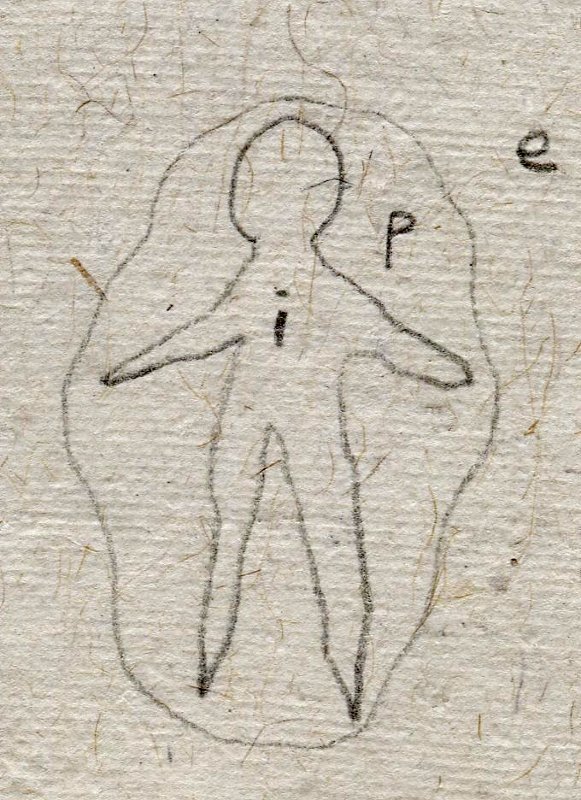
Figure 5.4. Lisa Roberts, Internal, Peripheral, and External spaces, Pencil drawing on notebook paper (2003)
With just two lines, spaces within and beyond a body can be imagined; two lines make an image that is easy to hold in the mind and body. With less words and lines to remember, it is also simpler to work with.
In an interview with choreographer Siobhan Davies (Appendix 1D), she suggested two kinds of scores to generate gestures for animating: First, words, drawings, and rhythms, and second, moving to a particular rhythm for a particular period of time. Her first suggestions were scores with open boundaries. Her second suggestion was a score with close boundaries.
Wunder defines a score as a set of parameters within which to improvise within varying degrees restraint (from open to closed boundaries) (Wunder, 2006, pp.144-165). Exiner and Lloyd use no specific word to refer to such catalysts for dance (Exiner and Lloyd, 1977) . I use the word score to include a range of catalysts.
A simple score of 'opening and closing' was used in a workshop led by Gill Clarke at the Siobhan Davies Studios. As a score with close boundaries, just two words provided the focus within which subtle variations in gesture and line could be discerned. Variations in the body's use of space, time and energy were easily felt when performing to this score. Figure 5.5 shows a drawing I made that combines body memories with direct observations of another dancer moving to the same score. Varying weights of line reflect varying sensations between tension and relaxation. Gestures generated by scores with close boundaries can be experienced, observed and drawn with clarity. Gestures generated in this way can be recorded onto video and traced to make animations that communicate body memories of motion.
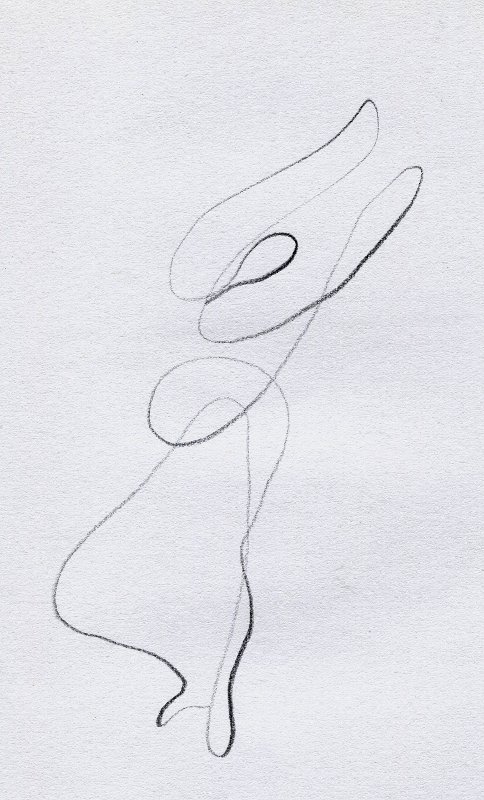
Figure 5.5. Lisa Roberts, Trace form of dancer 'opening and closing', Pencil on paper (2008)
Early training with Exiner had involved raising awareness of connections between moving body parts, the body as a whole and external stimuli within the surrounding space (kinesphere). Figure 5.6 shows notes I made as part of my training with Exiner. They describe plans for lessons conducted as field work as a beginning teacher. The first lesson aims 'to explore the different movement and gesture possibilities of different body parts'. The score for the first lesson was modelled on Exiner's classes:
Concentrating on specific body parts, extend movement of each as much as possible. Individually, students try different things, then a few movements are chosen and repeated by everyone: head and neck craning, circling, twisting, pulling in; hands shaking, flexing (remind of contrasting movements) ... [and so on, to activate all body joints](Figure 5.6).
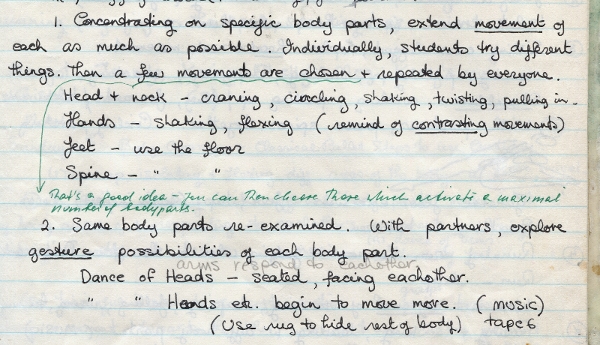
Figure 5.6. Lisa Roberts, Extract of lesson plans for Body Awareness workshop (27 May, 1979)
Exiner's notes, written in green ink over mine, underline my words, 'then a few movements are chosen', and she advises, 'You can then choose those which activate a maximal number of body parts'. This advice reflects her philosophy of dance as a way to experience connectivity through the body (Exiner and Lloyd, 1977, p.4) . Her other comments reflect the value of clear focus and simplicity:
Is everyone aware of the purpose of all these tasks? ... set yourself specific objectives and, in the course of a lesson ensure, as far as possible, that each student comes close to that objective or objectives.
In dance improvisation a few simple gestures can activate a maximal number of body parts. A few simple lines and gestures can be used in animation to empathetically activate many senses.
The workshops I had attended valued connectivity between internal (bodily) and external (environmental) spaces. However, most workshop leaders used scores that were too open to generate the clear gestures I needed to make simple line animations. For example, when sounds with no clear rhythm were used as scores for dance, and no clear boundaries for movement were defined, it was easy for the mind and body to wander. Although fluid gestures can be generated through such stimuli, they can appear amorphous and unfocused. Without a clear structure it is easy to become lost in oceanic feelings.
When I asked Siobhan Davies to suggest some scores for making Antarctic animations, she said,
maybe it's like a collection of things. If it's text and drawing, rhythm. I think to keep to a particular rhythm, this is choreographically, not anything to do with climate change, to be clear about a rhythm is an incredibly good discipline. To be clear about certain timings gives you a structure and a discipline, so you don't wander off and make phrase after phrase after phrase after phrase. One phrase begins to erase out if you're not careful (Appendix 1D).
Scores with varying degrees of close and open boundaries were used. Close boundaries tended to generate more defined gestures. Open boundaries tended to generate more fluid gestures. A range of scores was used to match the abilities and inclinations of the artists involved. Recorded gestures were selected to animate a range of responses to Antarctica.
Twenty workshops were conducted in 2008. The artists made gestures and drawings that were mostly purposeful and clear. Their gestures were easily drawn from direct observation, and clear to trace from video recordings. Their drawings were traced and animated to reflect a heightened awareness of their bodies in space.
Prior knowledge of art and dance was assumed, but no assumptions were made about a knowledge of Antarctica. No material relating to Antarctica was provided in the first workshops. Antarctic texts were introduced later to stimulate improvised movement and drawn responses. Some scores were planned before workshop sessions. Others were improvised to accommodate differences in capabilities and experience. Unpredictable changes in conditions included holes in the ceiling, noisy intrusions and people coming and going. Scores were designed to generate connections between the uncluttered studio spaces that we used and a purely imagined Antarctic space. Examples of scores used in movement workshops can be found in Appendix 5.
Observations of Antarctica had been recorded in a body of art works made in various media (See Introduction). The basis of these works were line drawings that were made in a journal that I took to Antarctica [footnote: The original journal was photocopied by the Australian Antarctic Division in 2003 and lodged in their Library at Kingston (Tasmania). The original was donated to the Tasmanian State Library in Hobart in the same year.]. The Australian Antarctic Division exhibited prints that I made from these drawings at Old Parliament House in Canberra (Antdiv, 2002). Drawings, paintings, and prints remain on permanent display at their headquarters in Kingston (Tasmania). Many employees there are expeditioners: scientists and support personnel who work in a variety of trades and professions.
Drawings were made as source texts for animations. Drawing provided ways to connect to Antarctica. As artist Frances Temple explains (Temple Sebasta, 2009):
When gathering resources for working, the first thing I do is draw. Drawing is knowing. It enables me to internalise the subject so that I can use my intuition as well as my knowledge.
Direct observations
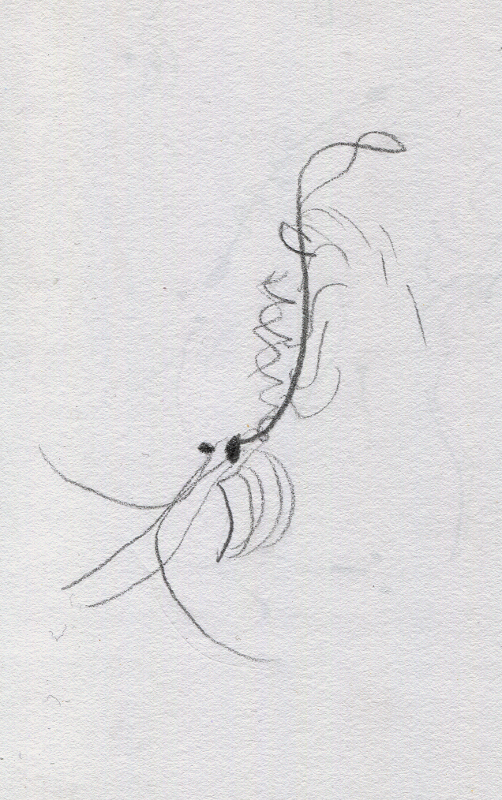
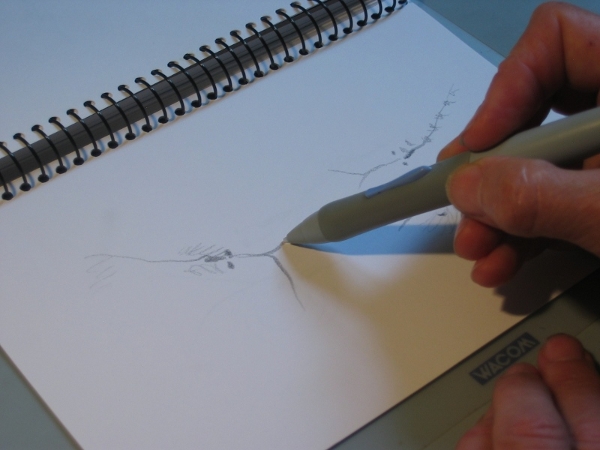
Direct observations were made through body-motion, contour, and motion-memory drawing. These internalised visceral (bodily) sensations. Accurate tracings were also made of data sets, and digital recordings of gestures and line drawings. Drawings were made during conversations with scientists and other expeditioners, in movement workshops with other artists, and independently in my studio and other locations.
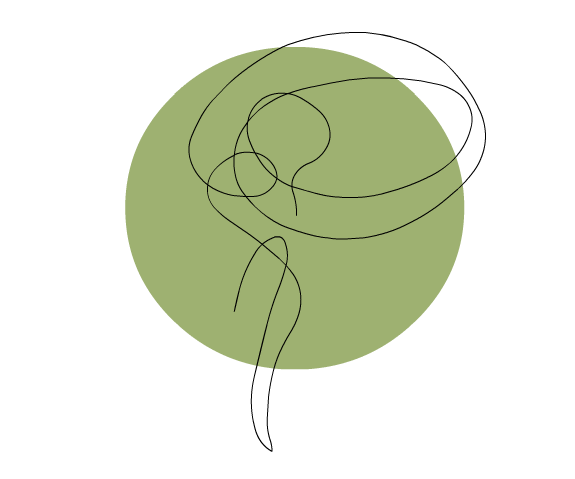
I had used body-motion drawing before, to register my response to being in Antarctica (See Introduction). This method was adapted for use with the simple forms of the circle and spiral, to show how aberrations from these forms reflect bodily responses. I drew this way to register a sense of moving through different places, and as a warm-up activity in workshops.

Spirals were drawn to connect to similar structures within the Antarctic environment, such as tiny marine life forms, and the great system of bottom water circulation. Motion-drawn spirals were traced and animated to combine with scientific data and to convey a sense of moving through the environment.
Contour drawing is a technique I used to record observations 'with the right side of the brain' (Edwards, 1981, p.84).
Neuroscientist, Jill Bolte Taylor, explains (Bolte Taylor, 2008, p.30):
To the right mind, no time exists other than the present moment, and each moment is vibrant with sensation ... our perception and experience of connection with something that is greater than ourselves occurs in the present moment. To our right mind, the moment of now is timeless and abundant.
Contour drawings were made with attention fully focused on the object observed, rather than on composing a drawing. When contour drawing, no conscious attention is paid to constructing a composition on paper. Instead, lines trace eye movements (like a seismic reading) as they scan for patterns in structures and movement qualities. My sense of connection between gesture and drawn line had been heightened by my experience of calligraphy workshops led by Vikki Quill.


Contour drawings were made while observing live krill, fur seals and dancers.
This method was used because it can convey a sense of immediate connection. Like body-motion drawing, contour drawing registers a spontaneous bodily response. But rather than describing abstract forms, contour lines trace observations of visible reality. Like calligraphy, a visceral connection can be made between the gesture and the drawn line. A high attrition rate comes with this method. Only trace the forms that appear to have a life of their own are kept. These can (when recognised) communicate a sense of seeing and feeling for the first time.
Lisa Roberts, Antarctic krill: Euphausia superba Pencil on notebook paper (2009)
Circling dancer is another example of contour drawing. It was made while watching a girl dancing with a hoop. A continuous line traces the form of a hoop and the girl's circling motion. Like the continuous line in the pentagram designed by Lenton Parr, to represent unity and interrelation, a single line traces connections perceived through all the senses, between a body, a hoop, and the ground over which they move.
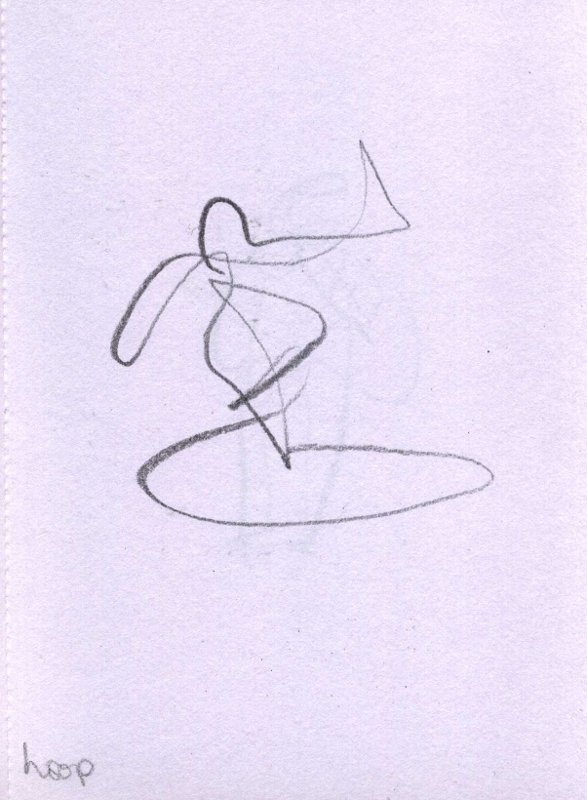
Lisa Roberts, Circling dancer (2008) Penicl on notebook paper
In 2004 I drew marine life forms that had yet to be named by scientists. The icebreaker, RSV Aurora Australis, had just returned from a voyage to Heard Island, with data collected from a towed camera.
The drawing, Antarctic benthos: sea floor life is one of many drawings that represent circular and spiral forms.
Lisa Roberts, Antarctic benthos: sea floor life, Pencil on notebook paper (2004)
Scientific reflections
Drawings were sometimes made with scientists during interviews. Simple lines were drawn to describe complex systems, and to clarify verbal explanations. Annotated drawings were made with scientists to validate the meaning of what they said. For example, when explaining the difference between sea ice and glacial ice, marine biologist, Steve Nicol, drew. We annotated his drawing together, with words and arrows to clarify its meaning. The drawing helped me understand key forces that shape the Antarctic ecosystem.
Lisa Roberts with Steve Nicol, How Antarctic ice works, Drawing on notebook paper (2009)
I later wrote what I understood about these forces, with editorial assistance from another marine biologist, Jaime Gomez-Gutierrez (Appendix 2):
Sea ice drives bottom water circulation through the Southern Ocean. Unlike the ice sheet that inches seawards from inland Antarctica and from which ice bergs break away, sea ice forms from sea water that surrounds the Antarctic continent. When sea ice melts during the southern hemisphere spring and summer, cold, salt-dense water sinks down to deeper layers. From there it moves outwards and upwards in a spiraling motion from east to west. This is known as the Conveyor belt, or thermohaline circulation, where water circulation is driven by changes in salinity and temperature that determine its density. This motion shapes the planet's climate through a feedback interaction between the ocean and the atmosphere. Through this complex mechanism, bottom water spirals outwards and northwards to join the circumpolar current, (ACC), or West Wind Drift.
The spiraling motion of cold bottom water circulation is particularly complex.
I described this motion through a whole body gesture which was later recorded on video, traced, and then animated.

Sometimes drawings were made after interviews with scientists, to help me physically connect to ideas they talked about. The drawing, Eccentricity, was made after listening to paleoecologist, Dominic Hodgson (Appendix 1C). He had explained that the sun is in the centre of the solar system, 'or the way humans describe the solar system', and that 'on a 100,000 year time scale the earth's orbit cycles between circular and elliptical. When Earth is closer to the sun, a warm interglacial period occurs. When it's further away from the sun, there's less energy, so the earth freezes up, in a glacial period. This is known as the eccentricity cycle of Earth's orbit around the sun'. The cycle of eccentricity is one of three cycles proposed by Milankovtich (Crowley, 2002).

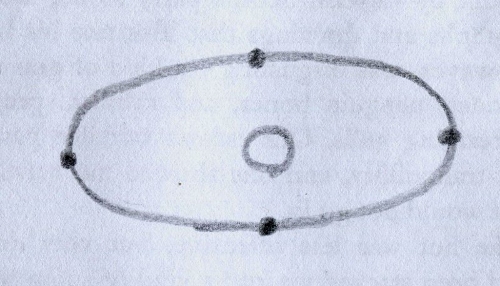
Lisa Roberts, Eccentricity, Pencil on notebook paper (2008)
Artistic reflections
Drawings were also made as ways to connect to how artists have described Antarctica. The drawing, Masson Range from Elliott reflects lines and tones used by Fred Elliott. While drawing in response to his work I recognised my experience. His light subtle lines against stark dark tones resonated with me. Responding to his image through drawing brought to consciousness forgotten kinesthetic sensations. I could imagine myself in the place his lines described. Elliott's drawings influenced my decision to use black and white in the animations.
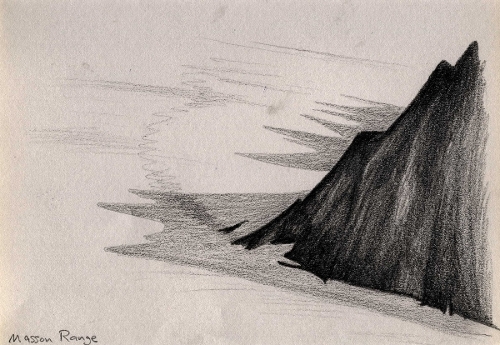
Lisa Roberts, Masson Range from Elliott, Pencil on notebook paper (2007)
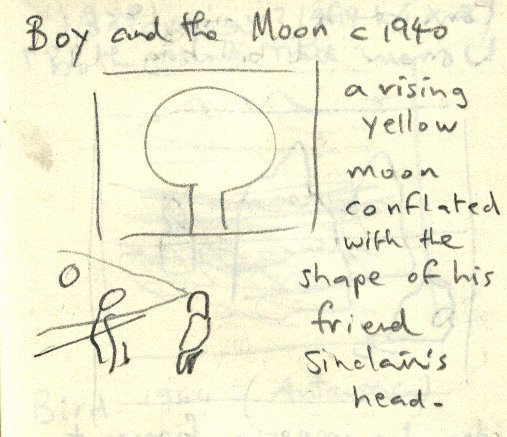
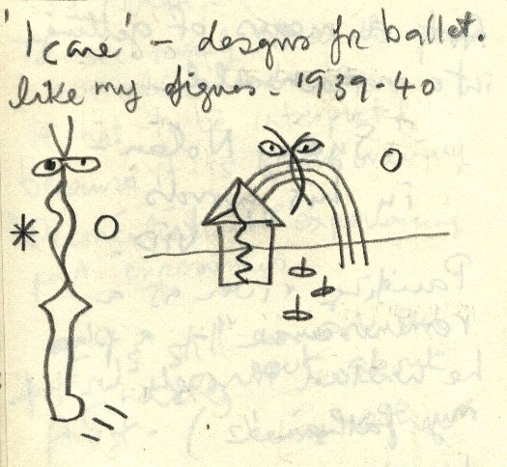
Some drawings were made spontaneously and seemed guide ideas for animations. For example, I made drawings at a retrospective exhibition of the artist Sydney Nolan. The exhibition included a drawing, Boy and Moon (c. 1940), and sketches he had made for the ballet, Icarus (1934-1940) (Nolan, 2007-2008). There was something about Nolan's lines that attracted me. Only later, while making animations, did I recognise these as primal forms that could express the sense of continuity that I had experienced in Antarctica. This sense of continuity relates to Nolan's idea of conflation. A circular moon and a man's head are conflated.
Lisa Roberts, Icarus (after Nolan), Pencil drawing on notebook paper (2007)
Lisa Roberts, Boy and moon (after Nolan), Pencil drawing on notebook paper (2007)
I came to recognise this phenomenon in many animations that I made, as a way of fusing objective and subjective responses.
For example, the simple shape of the human head, in Heard lull, represents a mind intensely listening. The figures in Nolan's designs for Icarus are a fusion of human and unknown life forms. These forms kept popping up in my work.
The drawing, Antarctic head (from Boissonnet), was made in response to Boissonnet's work, En perdre le nord (Boissonnet, 2008). Boissonnet had imposed a map of Antarctica on the top of a shaven man's head. Using this as the impetus, I drew and animated the form that describes Antarctica as a brain inside the head of a human. This was discussed in Chapter 3: Towards an iconography / Oceanic views.


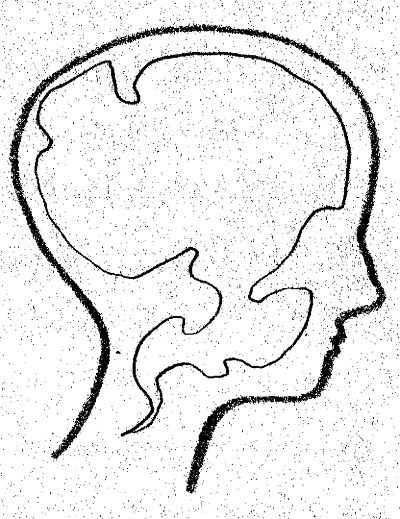
Lisa Roberts, Antarctic head (from Boissonnet) (2009) Online image
While traveling by plane at night over the Pacific Ocean, I drew as I read Coleridge's Rime of the Ancient Mariner, 'The sun came up upon the left, Out of the sea came he! And he shone bright, and on the right went down into the sea' (Coleridge, 1798). I drew the sun circling Earth, the ship crossing the globe, and the albatross shot by the mariner's cross bow.
From the air, the ocean below had appeared black against land lit up by many cities. Coleridge's image of the circular earth brought to mind its unity and wholeness. The cross of the ship and the bird that was shot, brought to mind human indifference.

These drawings were the catalyst for the animation, Ancient Mariners, in which the Earth breathes and marine life forms dance with the circle and cross.
Lisa Roberts, Ancient mariner (from Coleridge), Pencil on notebook paper (2008)
Moving images naturally attract attention. Animation is the visual language of change and transformation. Animations were formed by combining digital-tracing with hand-drawn straight-ahead improvisation.
Digital-tracing is a consciously controlled animation method. Digital-tracings were made in two ways.

First, prints of visual data sets and pencil drawings were placed on a drawing tablet and traced within digital image and animation programmes.
Second, the drawing tablet was used to trace over picture files that had been imported into the image and animation programmes. Rather than trace lines over paper, lines were traced over digital images by moving the cursor on screen. The first method was used for simulated-drawing and simulated-writing. This is where lines are animated to simulate the gestures originally made to draw them. The second method was used to trace video footage.
Digitally tracing data sets of sea levels rising. Photo: Ken Wilson (2010)
Digitally tracing drawings of krill. Photo: Ken Wilson (2010)
Digital tracing over video frames is a form of rotoscoping, 'a technique that consists of filming the action with a model, and then having the animator retrace the contour of the figure' (Wells, Paul and Hardstaff, 2008, p.109). This method was used to trace a gesture performed to describe bottom water circulation.
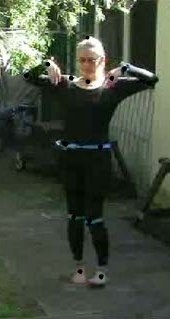
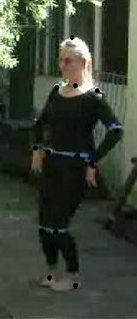
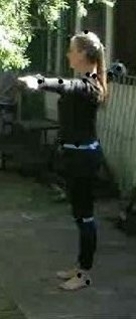
Lisa Roberts, Stills from video recording of bottom water circulation gesture (2008)
Stills were taken from a video sequence and dots were placed at pivot points on the body. The dots were then joined by lines on screen. When motions are complex and multidimensional, such gestures can sometimes describe them more clearly than through line drawings on paper. Stop-motion animation was used to record movements that lent themselves more naturally to physical rather than digital manipulation. Stop-motion animation is a method whereby a camera is mounted over objects which are manually moved and photographed frame-by-frame. This method was used to animate the complex interactions that occur between water molecules as sea ice forms and melts.

Gum nuts were placed and moved frame-by-frame under a rostrum camera. Each change in position was photographed frame by frame and then digitally traced.
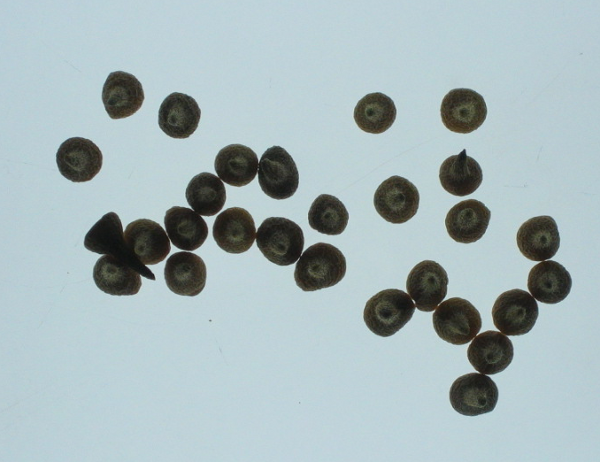
Gumnuts manipulated under a rostrum camera.
Improvised straight-ahead animation was based on the methods of McLaren and Lye and combined with choreographic methods of Vent and Drefke (McLaren, 1940; Lye, 1929) ;(Exiner and Kelynack, 1994, p.84). As Lye explains, 'You doodle about', 'to isolate some feeling out of yourself' (Lye in Horrocks, no date). This involves playing around with materials until the feeling is recognised.
Making art is a dialogue between the art maker and the materials. Responses are made to the work itself, as it evolves a life of its own. Intuitive, improvised, connections could be made between gestures and lines as they were being animated.

Len Lye's practice of freeing his 'old brain' to produce automatic 'doodlings' was used to draw, elaborate and animate the feelings associated with life forms that were yet to be named. Vent and Drefke's 'spontaneous forming' choreographic methods were adapted to combine such gestures and lines into integrated animated works. These methods involve (Exiner and Kelynack, 1994, p.84):
Playful searching, experimenting
Finding out, inventing, retaining memory of visual symbols and movement motifs
Repeating, varying, combining symbols and motifs
Composing by spontaneously forming the parts to make a whole
These methods were used to animate flows of energy through the Antarctic ecosystem and the human form:
Sea ice freezing and melting and the rhythmic flow of human breath
Spiraling bottom water circulation and a spiraling foetal gesture
The circumpolar current and a ship circling the globe
Through the improvisation process,
... every now and again one sees some little unexpected or meaningful juxtaposition of shapes, and this in some way generates an idea ... there is the satisfaction of having abstracted from the world something that was there, that perhaps no one else had seen. Some kind of redevelopment of vision occurs simply by this process of abstraction and reinterpretation (Parr in Sturgeon et al., 1984, p.44).
By improvising with a lexicon of primal gestural forms, known structures in the world could be identified and described in new and unexpected ways. Decisions on where to place dots and lines were made intuitively. Gestures and lines with similar qualities were grouped in rhythmic patterns. A time-based form of visual alliteration was evolved.

For example, in Bubbles in ice, swinging motions of lines that represent swings between glacial cycles, were placed over similar lines that trace the form of an improvising dancer.
Lisa Roberts, Bubbles in the ice, Digital animation (2008)
Rhythms observed in data sets were visualised in abstract form to connect to rhythms familiar to bodily sensations.
In Glacial cycles, the data set that describes the Milankovitch hypothesis (that is used to explain the swings between glacial cycles) was literally represented. However, in Measuring carbon, the same rhythms were abstracted and used as a score for a dance of circles. Colours of circles change through cycles governed by numbers of frames that were rounded off to reflect the cycles of the Earth's motion round the sun: Eccentricity (200 frames), obliquity (80 frames), and precession (40 frames).

The drawing, Cardiograph, is a tracing of my heart beat. It was animated to represent the spent energy of people who died and the forces in the ice into which they have fallen (Manhire, 2004).
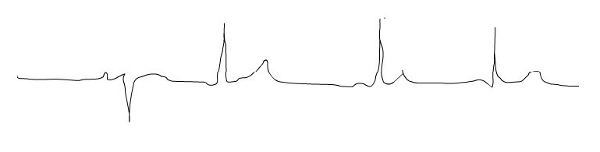
Lisa Roberts, Cardiograph, Digital drawing (2008)
The animations have found a niche audience in conferences of Antarctic art and science (See Discussion: Impact of the animations). They have been presented directly from the website and from files loaded onto computers. As vector graphic files playing from the web or disk, the animated lines appear sharp at all scales of projection. However, these formats are not yet accommodated by standard presentation software (such as PowerPoint). In order for the animations to be shared and re-used in standard presentations tools, they currently need to be encoded as .MOV or .AVI files. However, this this greatly diminishes their quality. To maintain quality and avoid problems with online access, the solution for the moment is to play the animation files directly from a data disk or a computer hard drive.
A summary of the production processes used make the animations is provided in Appendix 6.
Online interfaces were designed to test different ways to display the animations. These evolved from an Antarctic Thesaurus that worked primarily as a holding bay for information rather than an effective display space. Interfaces are: Insights, Energies, Elements, Encounters, Thesaurus, INDEX. These experiments are discussed in Appendix 7.
As the project evolved, the online animation interfaces became increasingly connected. Like cycles of stories retold, lexical elements appear and reappear throughout them, to be read again wholly and in part.
As English teacher, K. Yeo, commented (Yeo, 2008):
It is not through one single image or story that the experience is understood, but through the collection, the build up, the layers, the retelling that an experience is shared - the focus shifts (none of the stories are forgotten because of the new telling) with each addition to the story being told, so the story itself becomes an experience.
Animation interfaces provided different contexts for reading the animations. However, platform and software dependencies created an environment where display is not consistent. To create a consistent experience for the purpose of this thesis, the animations were transferred to CD, where they can be accessed through a browser. Nevertheless, the web has proven to be a globally accessible display space in spite of its constraints. Without the website and its log, it would not have been possible to interact with participants and receive responses to the work as it evolved.
My arts practice is not limited to animation. While the development of art works is often integral to the animation process, the works themselves stand alone. The works include drawings, paintings, art objects, and installations. An index of art works is on the website and the data CD that accompanies the printed thesis. The drawing of the dancer with the hoop became the icon to this link.

As animations evolved, I made art works. Dots and lines that were used to make digital animations were given physical form. The drawings, Ice turning and Ice mirror, are results of early experiments in stop-motion animation that evolved into art works in their own right. The drawings represent the idea that our actions shape our environment, which in turn shapes us. These are two of many drawings that resulted from repeatedly drawing shadows of moving bodies cast onto paper, and then filming their changing shapes, frame by frame.

Ice turning was drawn in response to the animation, Ice sound, which in turn was inspired by words from Jack Ward's 1955 diary (Ward, 1955). Dots and lines visualise bird calls that he imagined emerging from ice.
Lisa Roberts, Ice turning, Mixed media work on primed fire paper (2009)
Lisa Roberts, Ice mirror, Mixed media work on primed fire paper (2009)
A number of art works evolved from drawings that were made to develop ideas. These works range from small drawings in notebooks to larger works in various media. Engravings were made into Perspex and glass to bring the gestural forms off the screen and into objects to be held. Lines engraved into Perspex and glass gain definition by holding light. They can be illuminated naturally by the sun or by LED lights.
Cool me cocco represents an endangered plankton that is abundant in Antarctica. Coccolithophorids sequester carbon from the atmosphere. Their vast concentrations mean they are vital for maintaining equilibrium of the ocean's acidity. Increasing acidity of the marine environment is distorting their forms and endangering their existence. The thermometer in the bottle references the link between rising human impacts, global warming, and acidification.
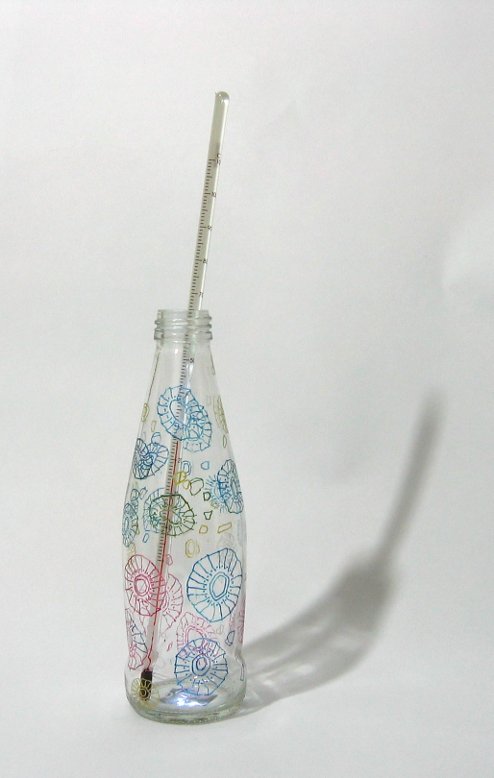
Lisa Roberts, Cool me cocco, Engraved glass bottle with thermometer (recycled) (2010)
Core images 01 represents imaginary marine life forms. The forms inspired by Nolan's drawings appear here as primal feelings trapped in ice. They reference the Greek myth that inspired Nolan.
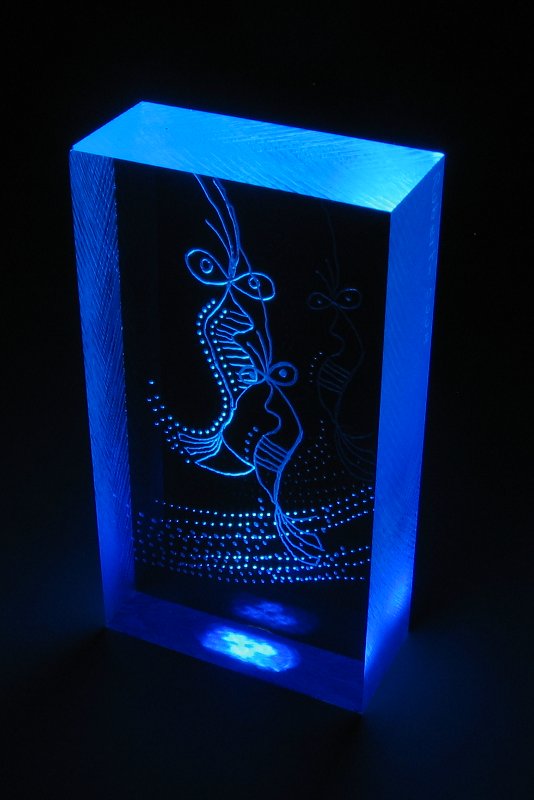
Lisa Roberts, Core images 01, Engraved Perspex (2009)
In the Greek myth, Icarus flew too close to the sun and lost his wings. This work refers to the environmental consequences of unsustainable ambition. It also references the idea that humans once returned to live as creatures of the sea (Hardy, 1960). The word 'core' in the title has a double meaning: body memories of ancient ancestors that reside in the core of our being, and the ancient history of the Earth recorded in cores of ice.
Lines were made from tracings of graphs of sea levels rising. In the animation, Sea levels are rising, the lines were used in order to combine scientific data with a sense of the motion of the sea over time. Lines were then engraved into sheets of Perspex and joined together to make the object, Sea levels rising 01. Here, lines that plot the data resemble a more familiar view of the sea, where wavy lines resemble the rising of a swell. Additionally, the repetition of the line (on two sheets of Perspex) gives physical depth to the data that expands the temporal experience of the animation. You may imagine yourself within the data (in the sea).
Antarctica registers changes combines graphs of sea levels rising with the part human, part plankton forms inspired by Nolan. Placed beneath the rising line of the sea, they reference primal feelings that arise from what Len Lye had referred to as our 'old brain' (Cann and Curnow, 2009).
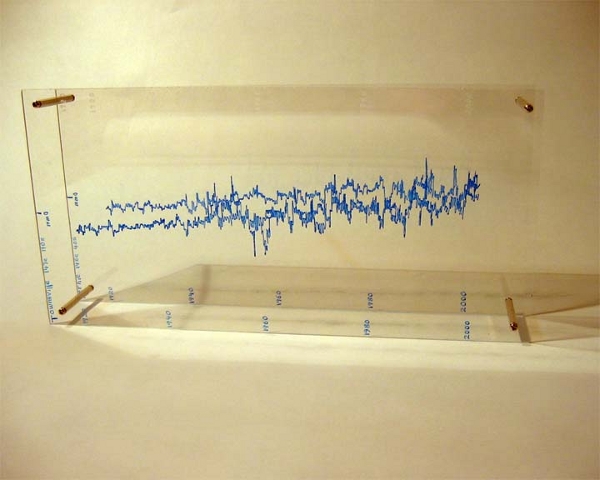
Lisa Roberts, Sea levels rising 01, Engraved Perspex (2007)
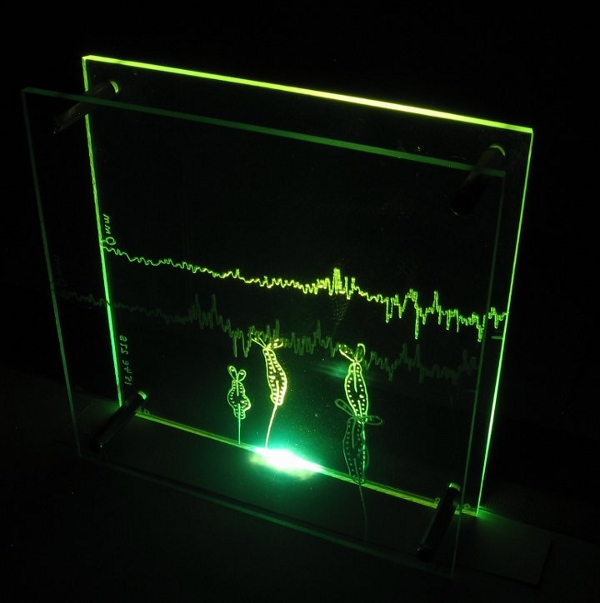
Lisa Roberts, Antarctica registers changes, Engraved Perspex (2009)
The art works provided ways to reflect on key ideas that emerged from animations, when scientific data connected most strongly with subjective responses. They were displayed at conferences and exhibitions as icons that embody fleeting moments of connection. They provide a durable record of insights gained through the animation process. A more detailed discussion of the use of these works can be found in Chapter 7: Discussion / Reading the ice and Chapter 8: Discussion / Impact of the animations.


