Everyone has their own perspective. So how can people see from other points of view? How can we expand our view? What are our limits? Can our views be combined? Can Antarctica serve as a global reference point?
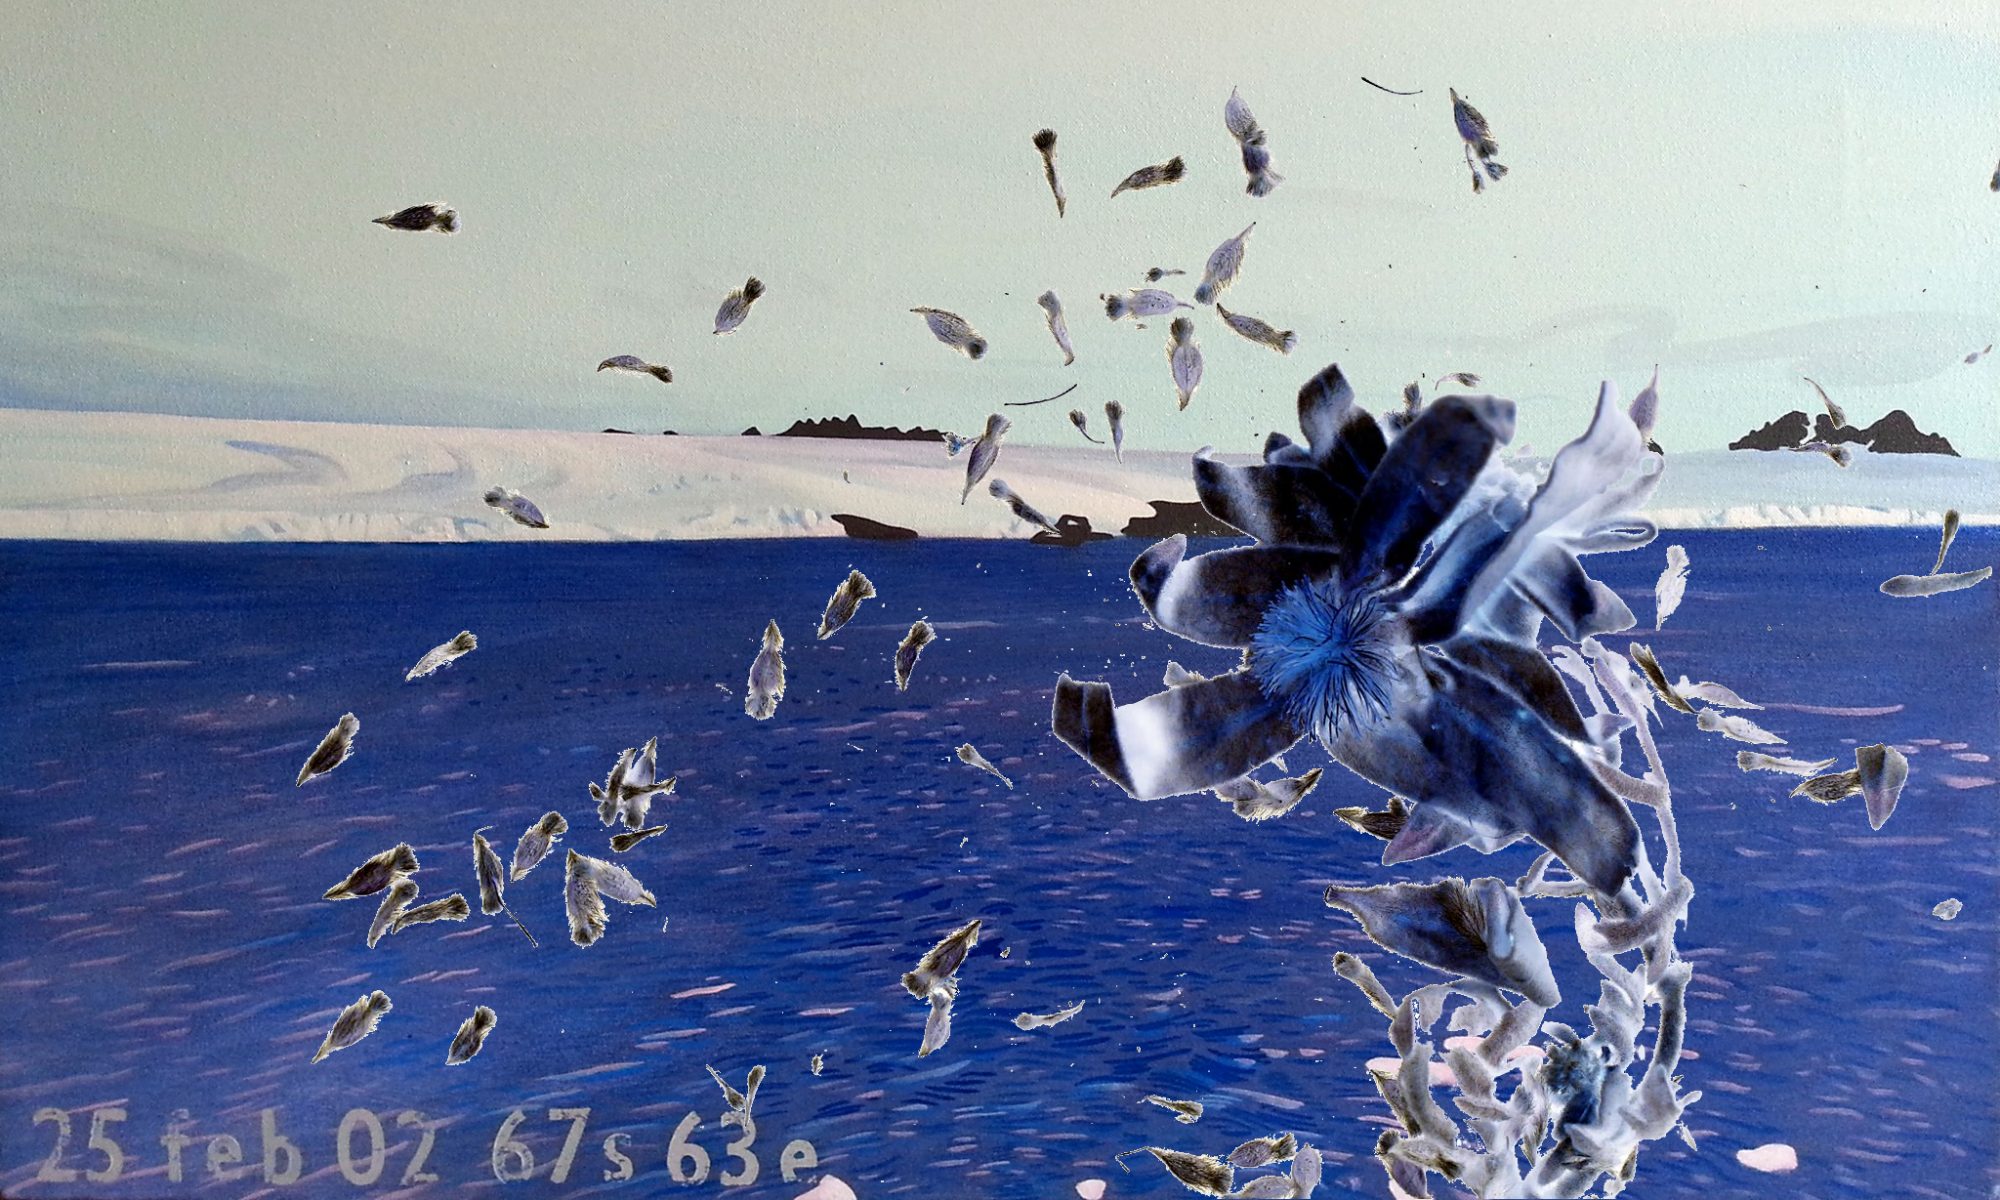
This picture brings together images that have come from interactions with many people and places over many years. This helps me see some limits of my perspective, based on my experience. It also suggests ways for other people to tell and connect their stories, in their own ways, to build a bigger picture.
Other pictures could be made – physically and digitally – with Antarctica accordingly rotated – to map stories that relate to Southern Ocean currents and celestial bodies that connect us all – sun, moon, and the Pleiades constellation (Seven Sisters).
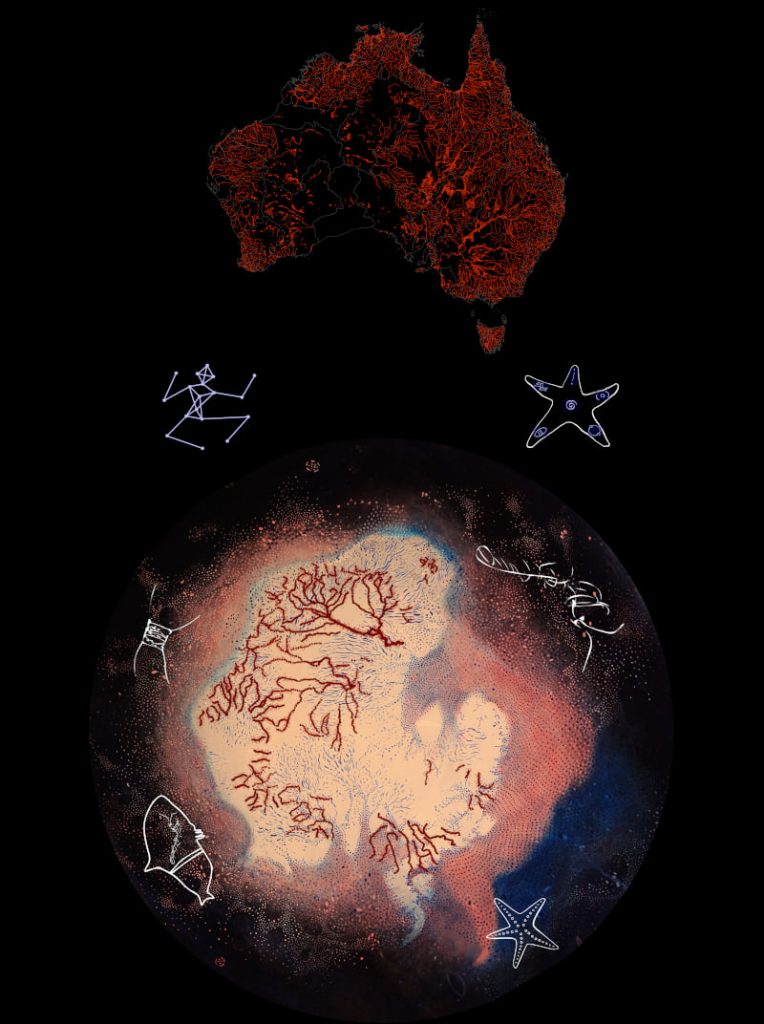
So I ask myself, How to incorporate celestial constellations and ocean currents into this picture?
I can animate celestial bodies and ocean currents as lines dancing above the picture, with icons in the picture serving as portals to stories told in different ways. For example, the Pedestrian leading to the interactive performer (being developed with Cat Kutay), and the starfish leading to the Lunar Time Library (that’s being arranged according to Ways of Thinking identified by Tyson Yunkaporta).
But what are other peoples’ perspectives and knowledge systems?
I put my questions to Facebook friends.
Cartographer friend Dane Bowles responds: “To the extent that as the earth rotates the sun and the position of the moon moves through the zodiac, or any other set of constellations, you might say that the moon and sun induced tides form a slowly rolling wave mirrored across the sky.” I love how his word picture embodies so simply the massive rhythmic heave of oceans lifted by the sun and the moon, and the star map mirroring sacred sites on earth.
…